
The nautical chart is a graphic representation of a part of the earth's sphere which gathers all the information of interest to professional navigators and yachtsmen.
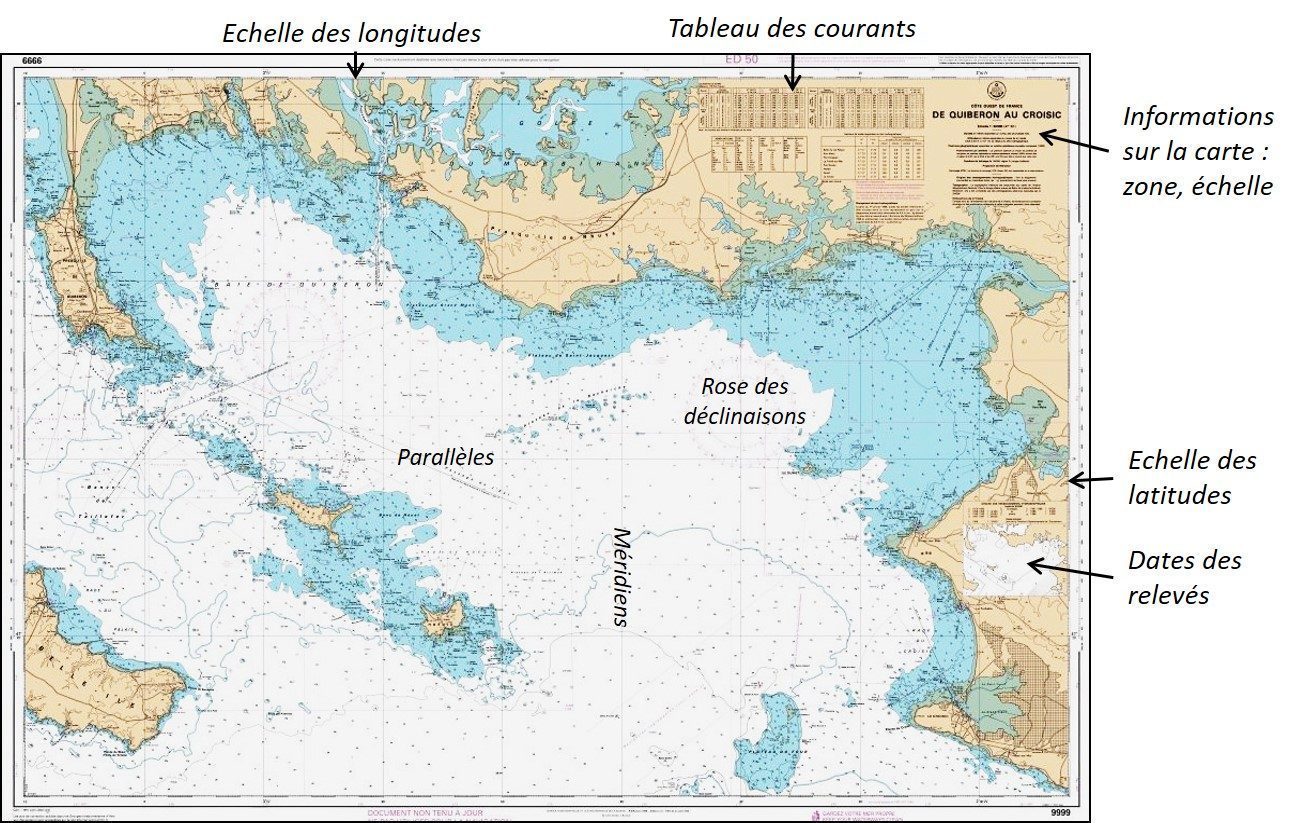
The area represented is more or less large depending on the scale of the chart. Remember also that symbols and hazards are more detailed on small-scale charts than on large-scale charts.
A reminder of the concept of scale
Scale is the relationship between the actual measurement on the ground and the measurement of its representation on the map It is expressed by a numerical value in the form of a fraction. On your map SHOM 9999, the scale 1/50000 (known as "1:50 thousandth") implies the following formula: Apparent measurement = Actual measurement x (1/50000) The representation is 50000 times smaller than the real measurement: 1 centimetre on the map represents 50000 centimetres in reality, i.e. 500 metres.
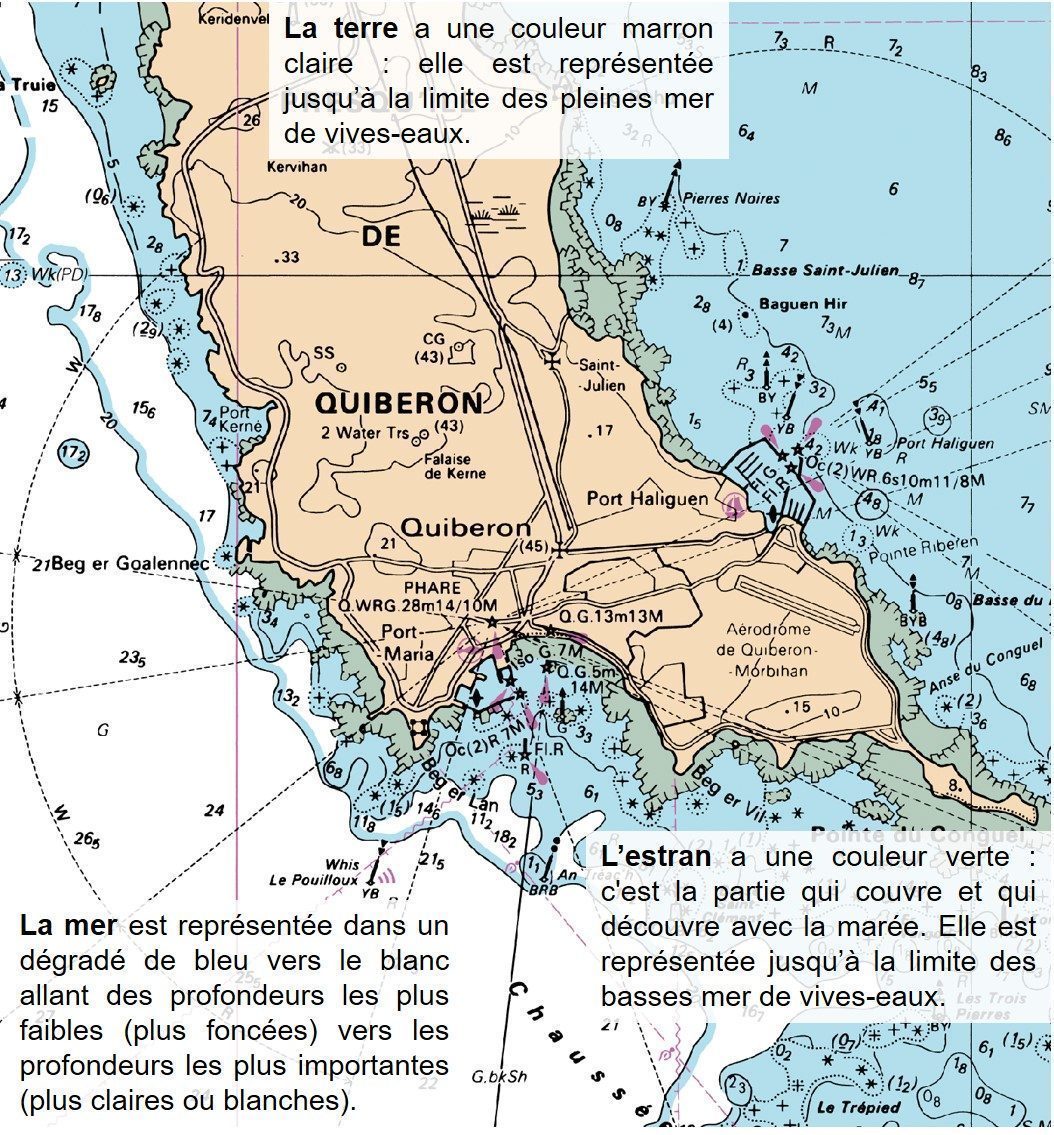
The three zones in three colours: land, foreshore, sea
Probe and probe line
To remember! On the nautical chart, all the sounding measurements (sea and foreshore) are made in relation to the hydrographic zero
Definition of chart datum (SHOM): Chart datum is the reference level for nautical charts and tide books. Chart datum is close to the lowest water level (coefficient 120). This choice is convenient, as the mariner is assured of at least as much water as indicated on the chart regardless of the tidal range (weather permitting).
Three types of soundings are shown on the chart:
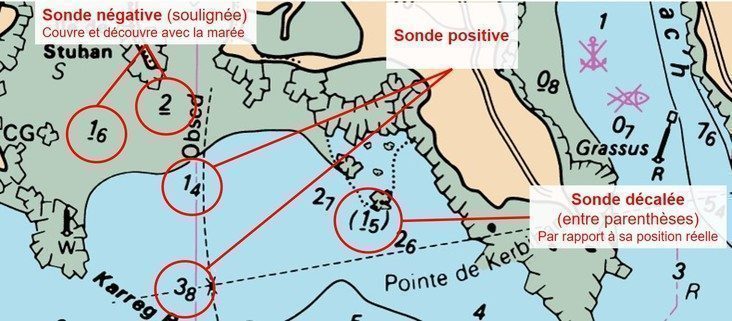
Sounding values are shown in meters with possibly a decimal value marked in a smaller offset to the right and slightly lower. For example, on the map below, the probe to the right of "Karreg" has a value of 3.8 meters and the probe just above "Grassus" is 0.7 meters.
The positive probes indicate the minimum of water available at chart datum (in meters). The positive probes are always covered with water of their indicated value in meters. The numbers indicated in small downward shift represent the decimals.
Underlined soundings are called "negative soundings": they are sand, mud or rock banks that cover and uncover with the tide of the value indicated on the chart.
Shifted soundings marked in brackets indicate that for reading convenience, the value of the sounding has been shifted on the chart from its real position.
Understand the concept of a probe
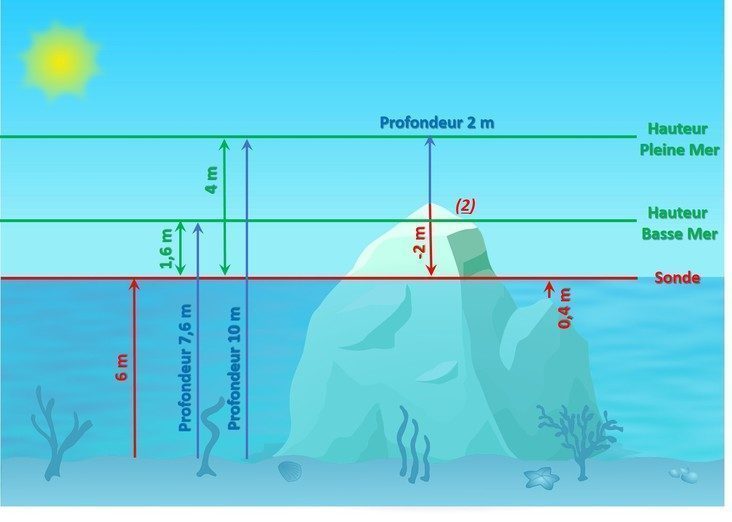
The Sounding is a constant value and that's why it is indicated on the map. It is defined in relation to the hydrographic zero, i.e. the lowest level that the sea can reach. The depth is therefore the minimum amount of water available to the navigator.
Be careful! If a sounding is underlined, it means that a rock or a sand bank is uncovered from the indicated value at low tide.
The Water level is the variation of the sea level at a given moment according to the tide above the probe. At each tide, thetide directory the value of the water height at low tide and the value of the water height at high tide. These values change every day, all year round.
Calculation methods (rules of twelfths, graphs or numerical tools) allow to know at any time the value of the water height between each high and low tide. Discover these calculation methods in our course "Tides: navigation and calculations" available soon.
The depth is the sum of the depth and the water height at a given moment. It is measured at sounder.
To remember ! Depth = Water height + Probe P = H + S
This calculation formula allows us, for example, to calculate the available depth given the draught or to show the exact value of the depth sounder under the boat in an anchorage area.
Probe lines: these are the lines of equal probes
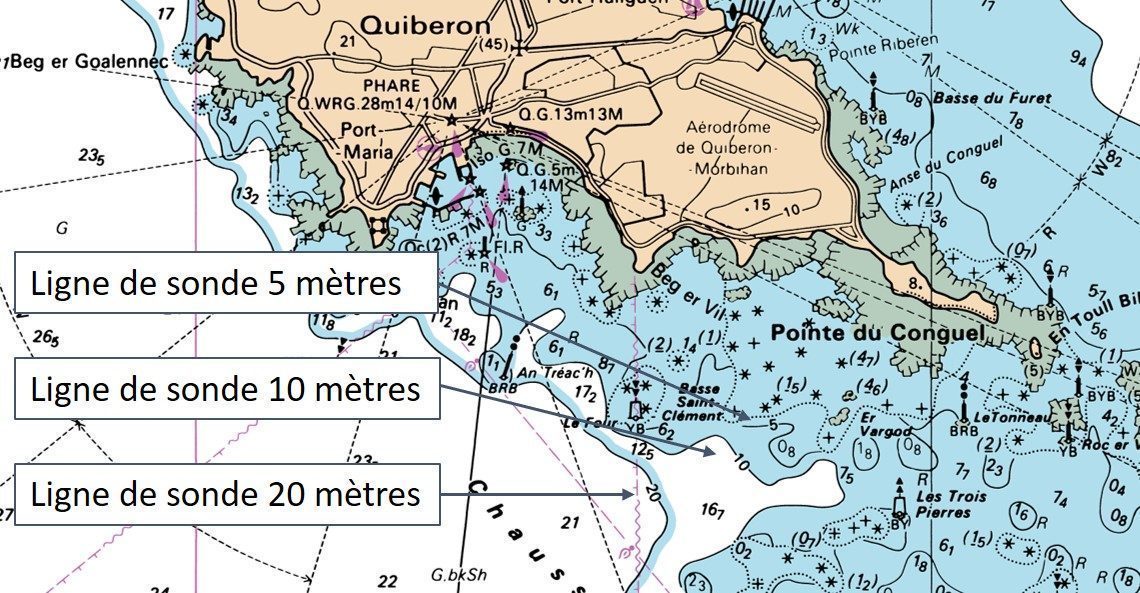
Chart symbols
Nautical charts contain a multitude of symbols to the point that a specific document(1D work from SHOM) has been published to list all possible symbols (international standard used by all national hydrographic services).
Nevertheless, the main symbols and abbreviations can be grouped by categories, knowing that some of them are more frequently encountered than others
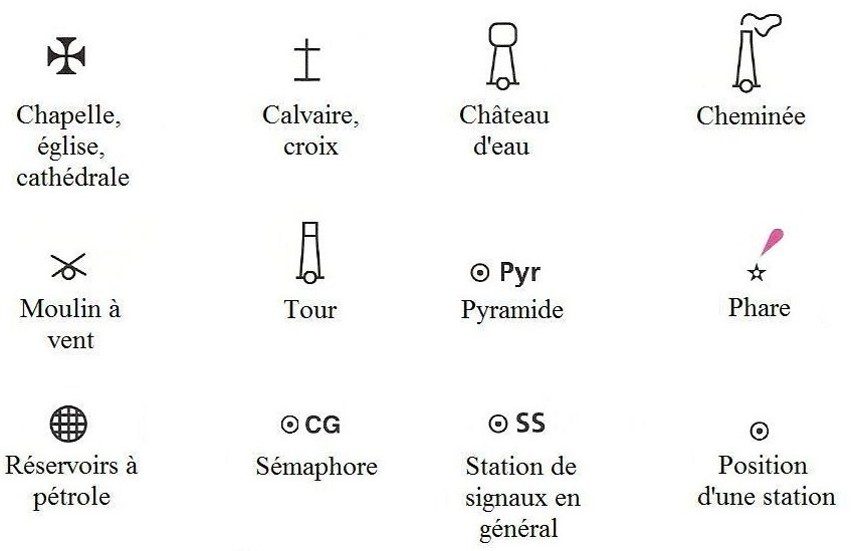
Main landmarks: churches, water towers, semaphores, ..
These symbols will allow you to visualize landmarks located on land and can be used for compass bearings or visual alignment.
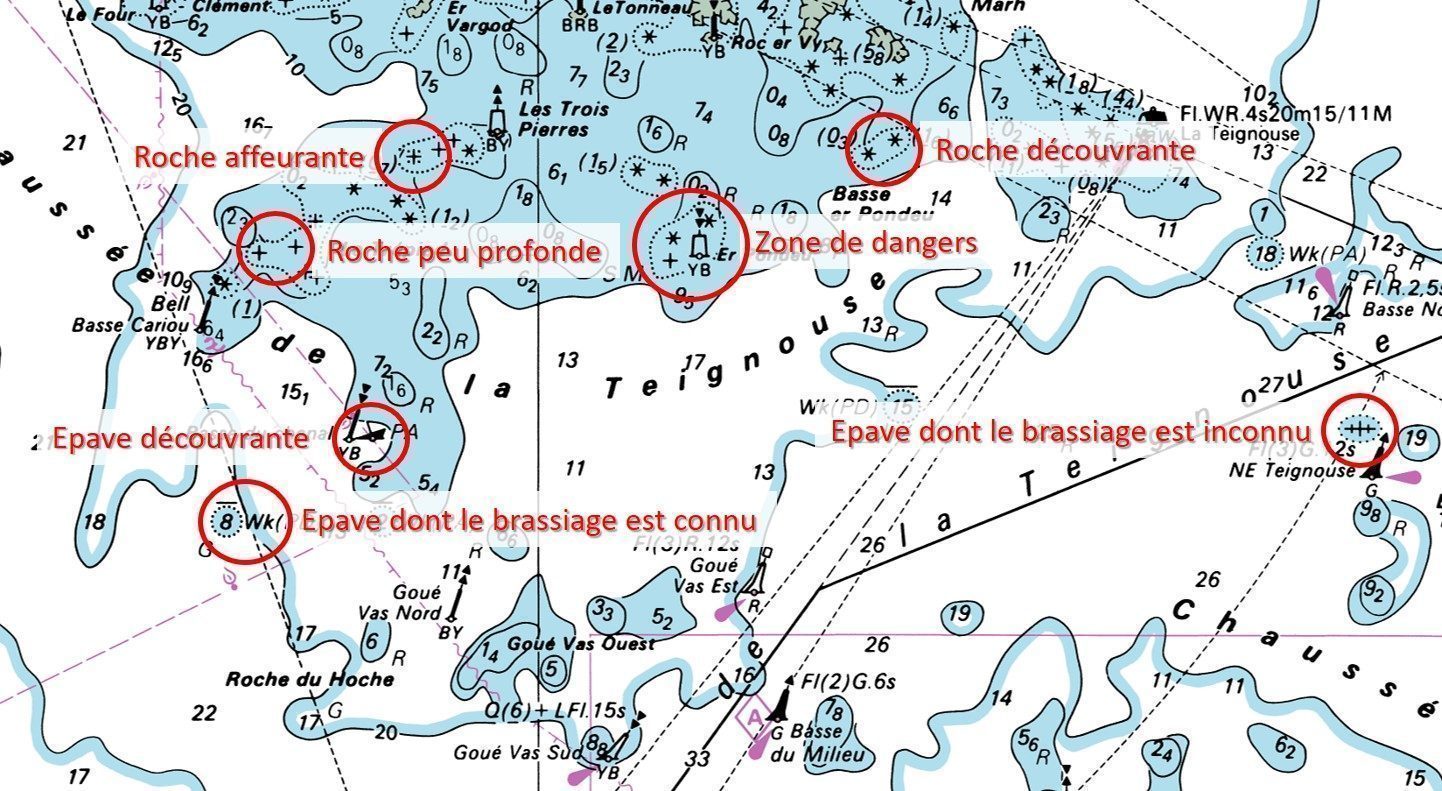
Dangers: rocks, shoals, wrecks,...
These symbols are very important to know because they represent dangers or dangerous areas for navigation.
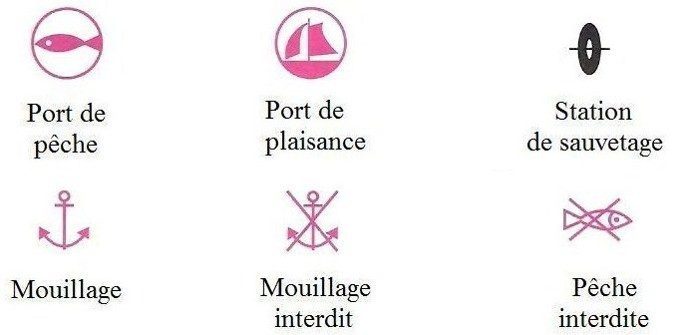
Ports and anchorage areas
Thesesymbols give information on the characteristics of certain ports or areas.
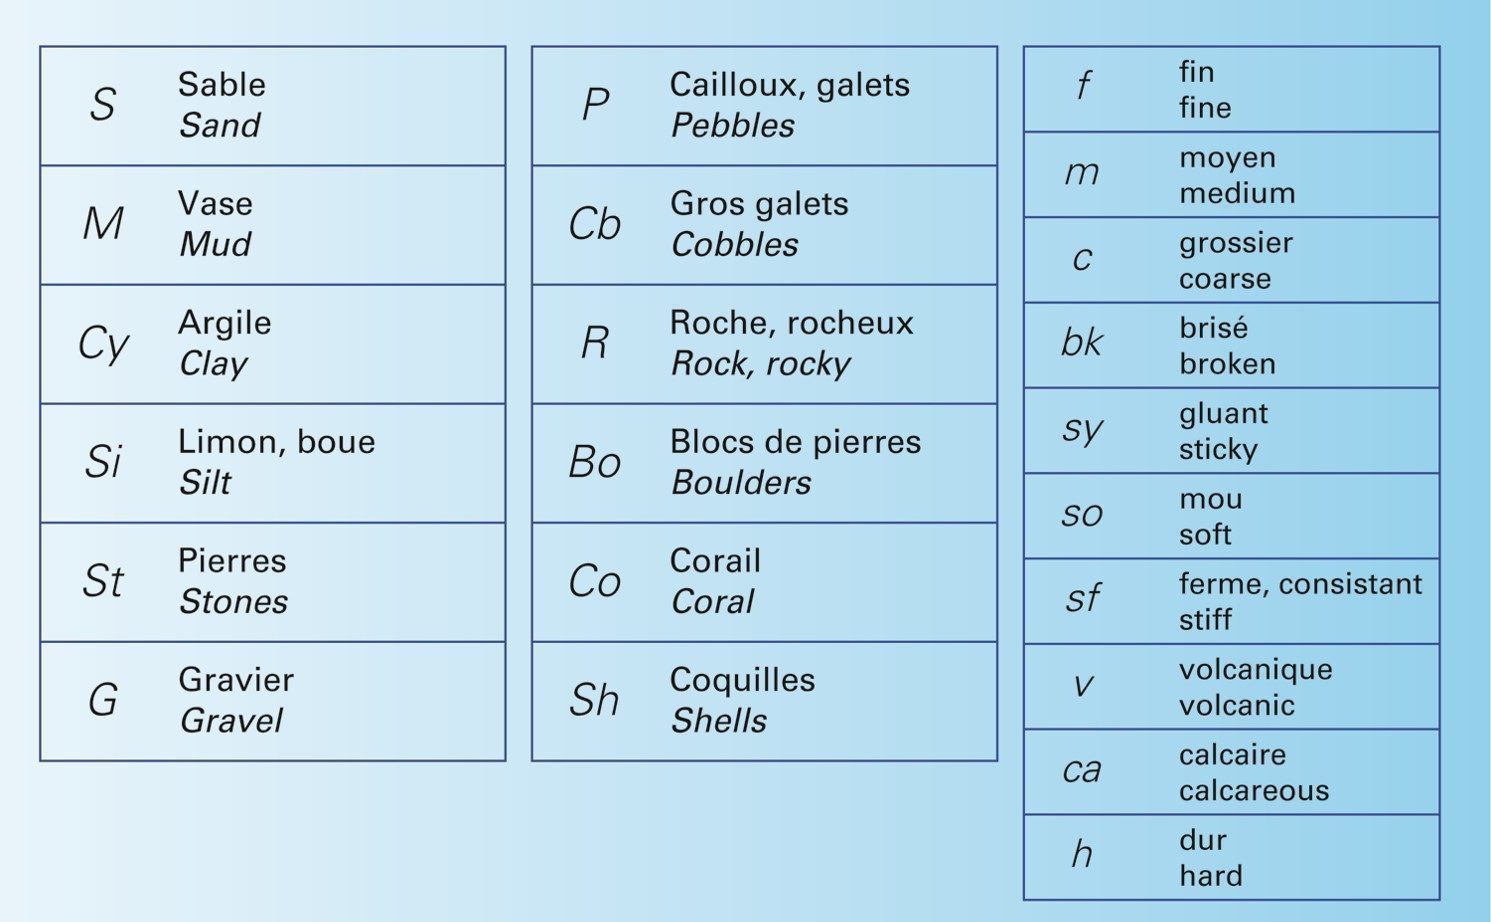
The nature of the bottom
For pleasure boating, the indication of the nature of the bottom is useful mainly to find an anchorage area.
Beacons, lighthouses and lights on the chart
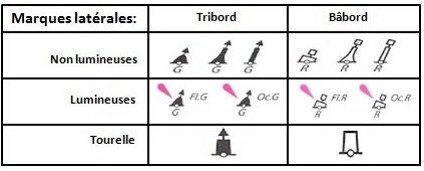
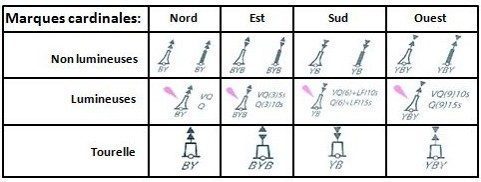
The main symbols and abbreviations concerning buoyage are
lateral marks, starboard and port
cardinal marks, North, East, South and West
isolated hazard marks, safe water marks and special marks.
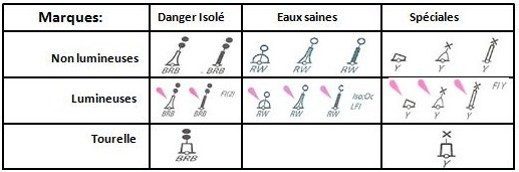
The colours indicated below the markers are :
- B: for black
- W: for white
- G is for green
- Y: yellow
- R: for red.
The Line Position
Ranges are natural or specific markings (coloured signs and/or flashing lights) placed on land which, when visually positioned opposite and above each other, indicate a perfectly safe route into or out of a port or along a passage.
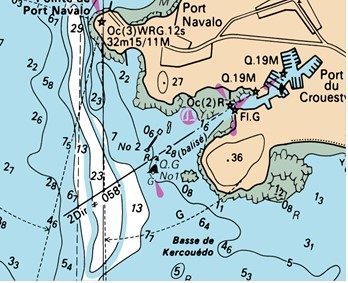
Ranges can be marked on the chart, for example this range is 058° but they can be plotted on the chart when two landmarks are visually located.
How to find your way on a chart?
To find your bearings on the chart, find a grid:
The horizontal lines are called parallels and are marked by angles from 0° to 90° to the North and to the South. The origin 0° is located at theequator. They mark the latitude symbolized by a large L that can be read on the right and left sides of the map
The vertical lines are called meridians and are marked by angles from 0 to 180° to the West and to the East. The original meridian, 000° , is the Greenwich meridian. They mark the longitude, symbolized by a large G which can be read at the top and bottom of the map
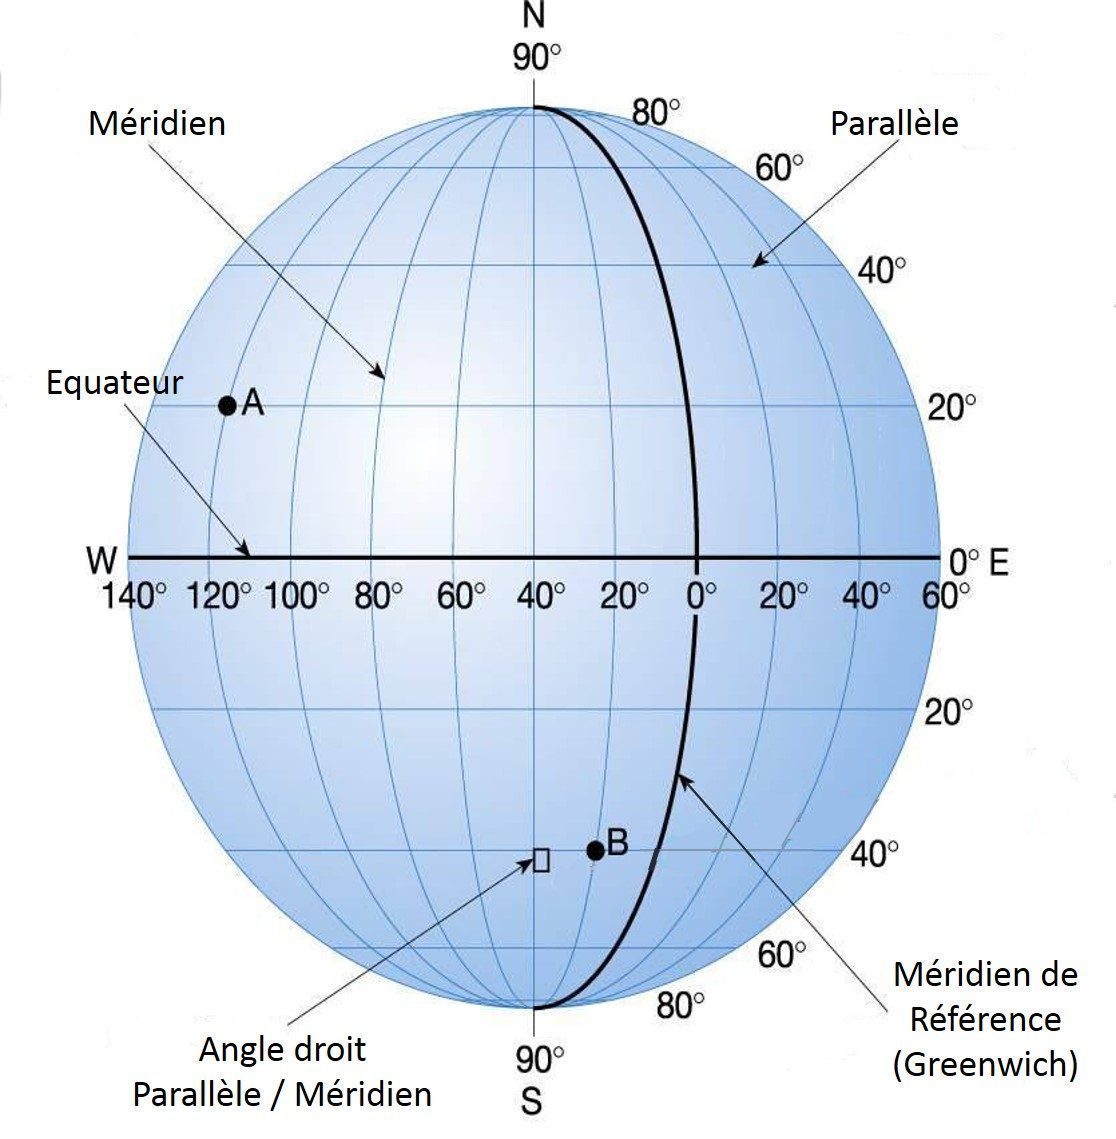
Thanks to this grid you can put a point on the map or take a point on the map and know its position. The position of this point is precise and unique anywhere in the world.
Example 1: the position of point A is L : 20°North and G : 120°West
Example 2: the position of point B is L: 40°South and G: 20°West
Locating a position in latitude and longitude
To define a position, it is necessary to refer to the latitude scale (on the right and left of the map) and to the longitude scale (on the top and bottom of the map)
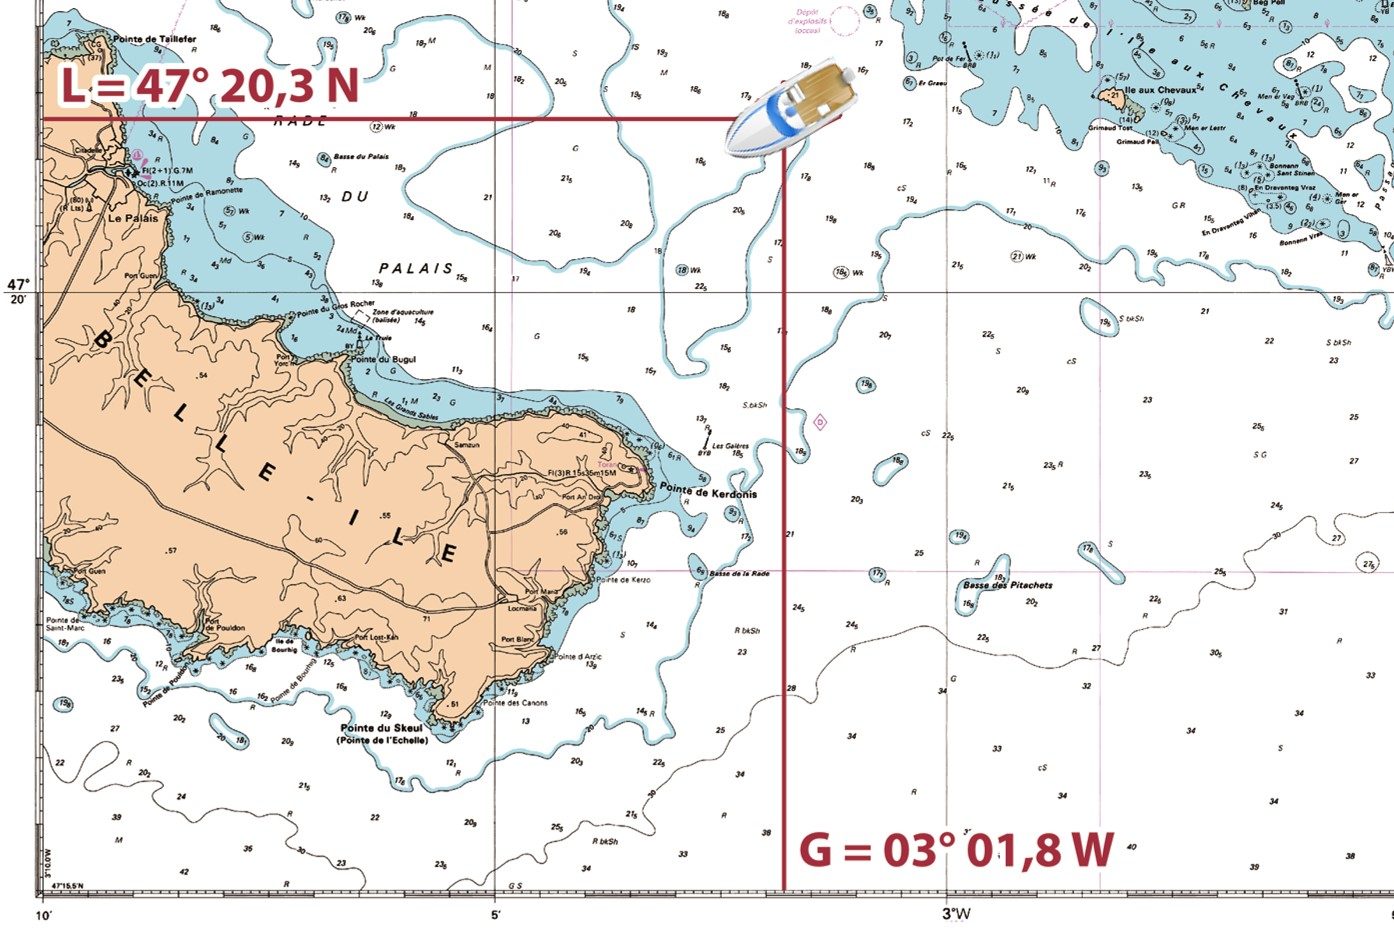
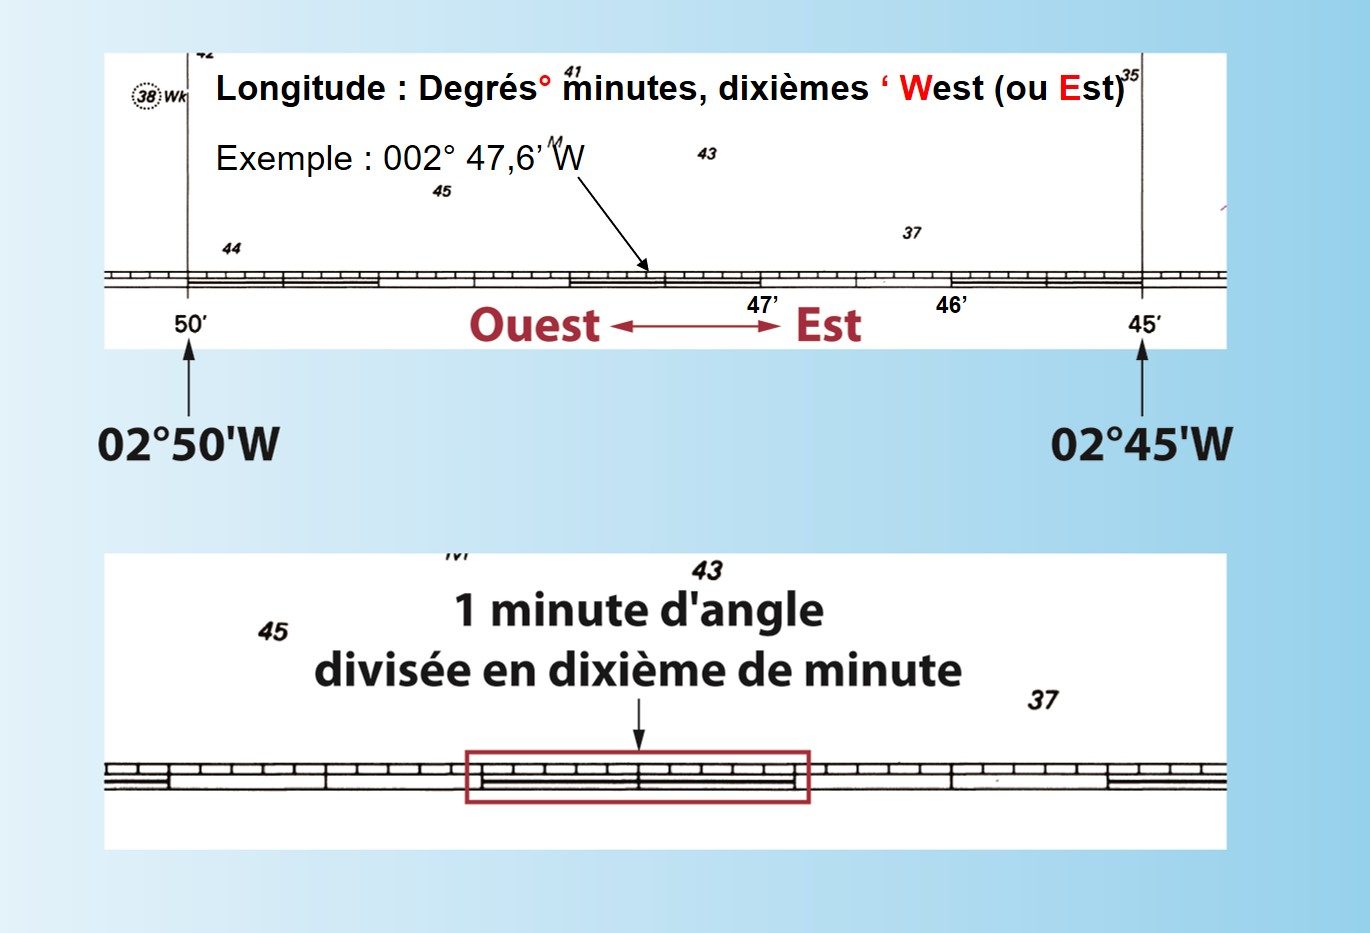
The definition of a position in degrees only is insufficiently precise. In maritime or air navigation, degrees of latitude or longitude are subdivided:
1 degree is divided into 60' minutes and 1' minute is divided into 10 tenths
On the latitude scale we find: the latitude (L) in degrees°, the minutes comma' and tenth of minutes North or South
On the longitude scale (G) in degrees° minutes decimal tenths of minutes East or West
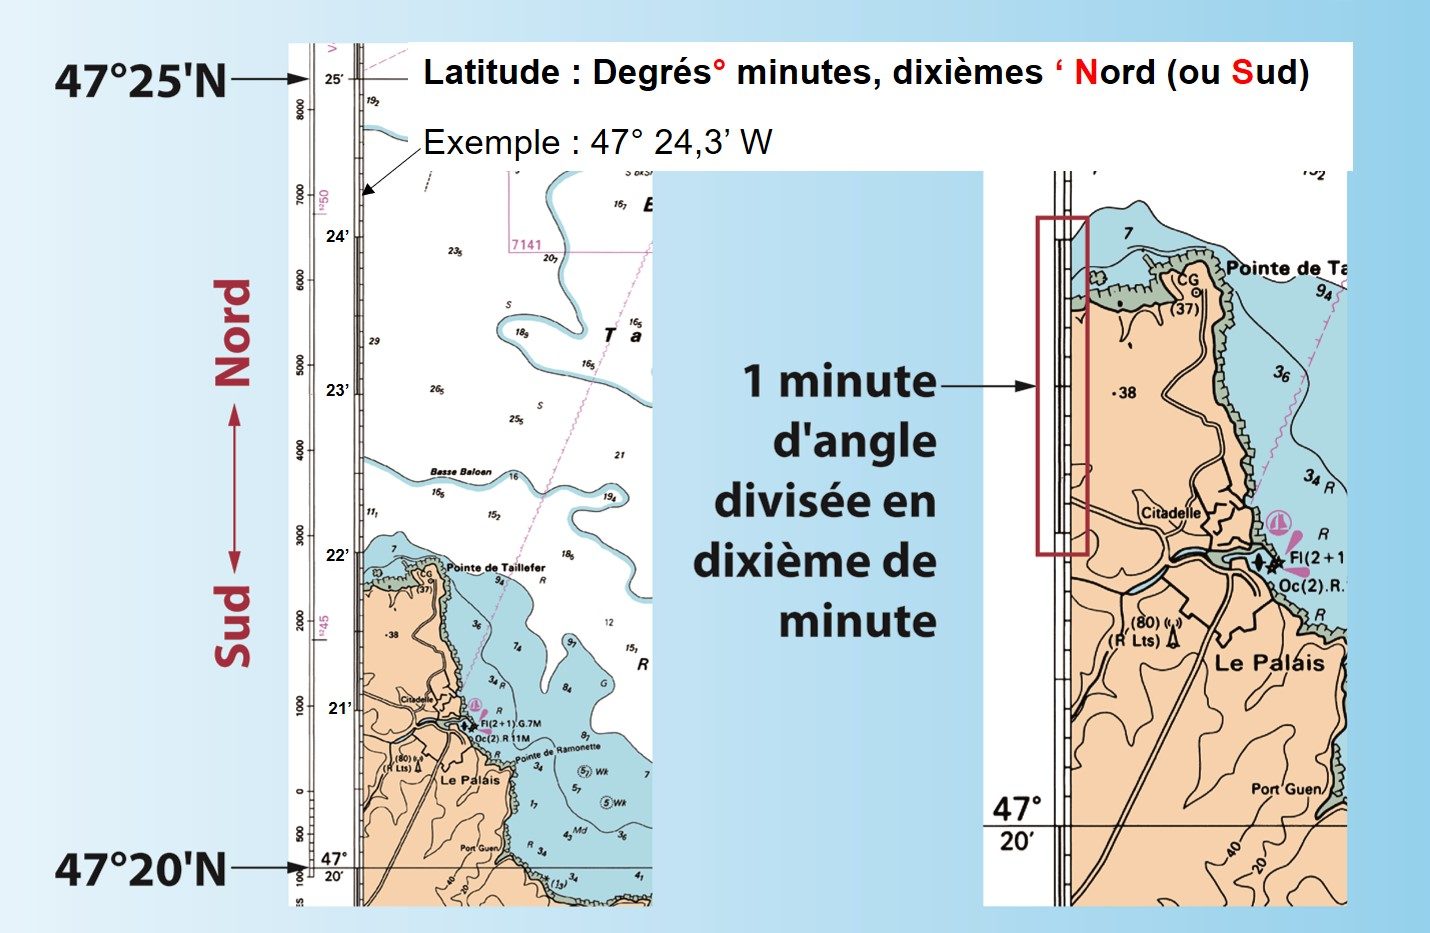
How to determine a distance on the chart?
Remember! 1' minute of latitude is equal to 1 nautical mile (i.e. 1.852 km)
To measure a distance, you just have to measure with a simple tool (pencil, piece of string, ruler or dry point compass...) the distance between two points and to transfer this distance on the latitude scale (on the left or right side of the chart).
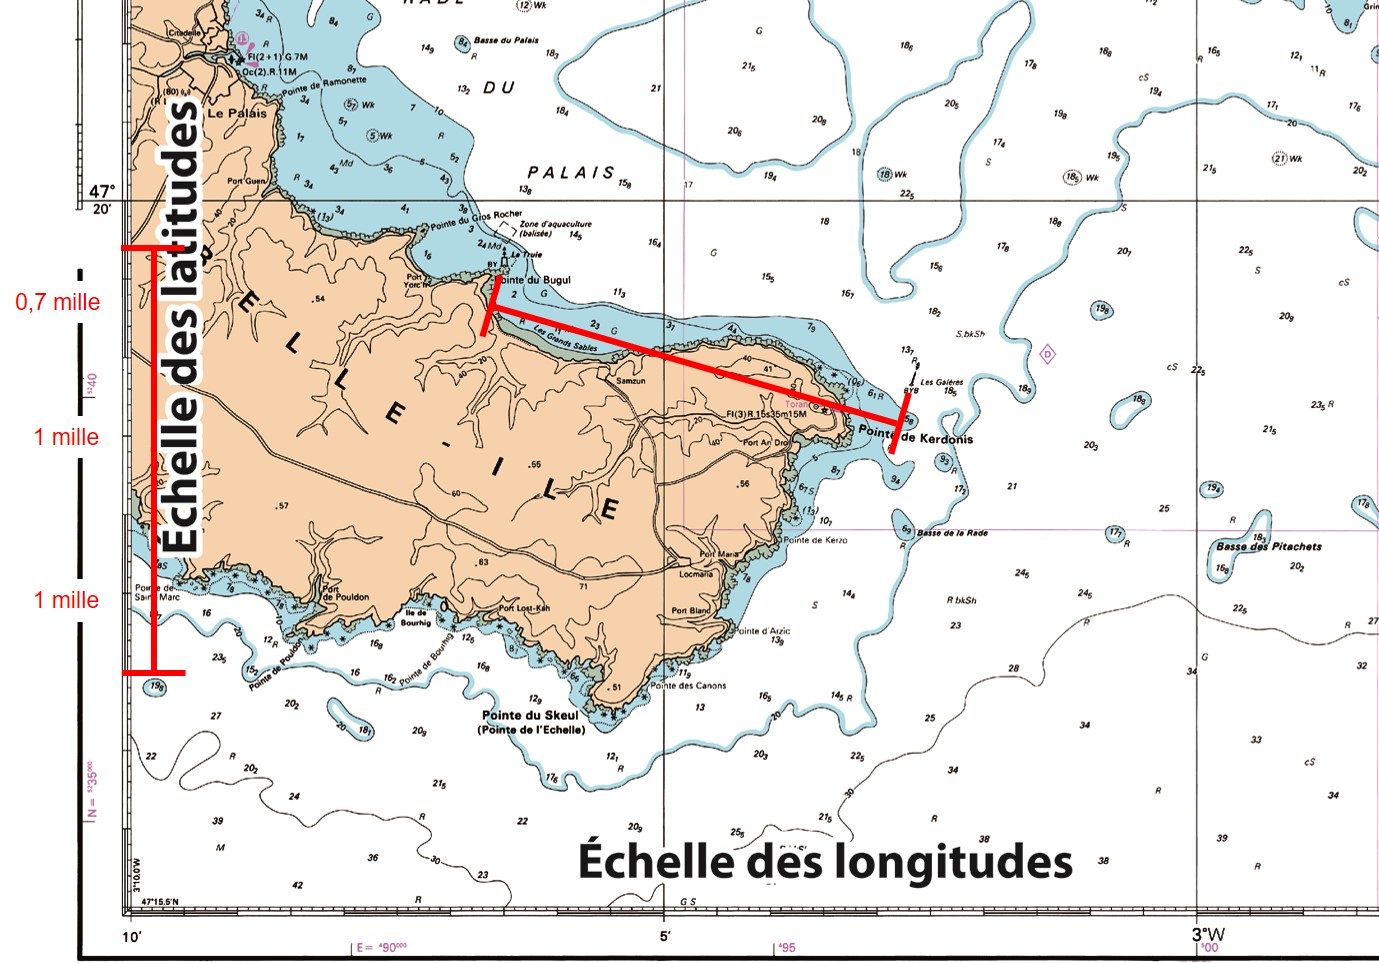
Each minute of latitude is worth 1 mile and subdivisions in tenths allow to give more precision to its measurement: 1/10th of a minute of latitude is called an encablure.
In this example, we are measuring the distance between Les Galères and La Truie. By plotting this measurement on the latitude scale, we determine that this distance is 2 minutes and 7 cables, or 2.7 miles.
The coastal and offshore charts are on Picksea
Now that you know (almost!) everything about nautical charts, all you have to do is to practice. You will find a wide range of navigation charts from SHOM You will find a wide range of navigation charts from NV-Charts, Imray or Navicarte and for all navigation areas in France, Europe and the world
And if you can't find yours, contact us! We can get it for you